In this video, we had discussed about the impact of climate change towards aquaculture and methods to overcome those challenges.
Thursday, December 15, 2016
CLIMATE CHANGE AND AQUACULTURE ISSUE
In this video, we had discussed about the impact of climate change towards aquaculture and methods to overcome those challenges.
Monday, December 12, 2016
THE AQUACULTURE FUTURE & RESEARCH
AQUAPONICS – INTEGRATING AQUACULTURE
AND HYDROPONICS
Aquaponics is a symbiotic
integration of two mature food production disciplines: (i) aquaculture, the
practice of fish farming; and (ii) hydroponics, the cultivation of plants in
water without soil.
Aquaponics combines the two within a closed recirculating
system. A standard recirculating aquaculture system filters and removes the
organic matter (“waste”) that builds up in the water, so keeping the water
clean for the fish. However, an aquaponic system
filters the nutrient‑rich effluent through an inert
substrate containing plants. Here, bacteria metabolize the fish waste, and
plants assimilate the resulting nutrients, with the purified water then
returning to the fish tanks. The result is value-added products such as fish
and vegetables as well as lower nutrient pollution into watersheds.
Aquaponics
has the potential for higher yields of produce and protein with less labour,
less land, fewer chemicals and a fraction of the water usage. Being a strictly
controlled system, it combines a high level of biosecurity with a low risk of
disease and external contamination, without the need for fertilizers and pesticides.
Moreover, it is a potentially useful tool for overcoming some of the challenges
of traditional agriculture in the face of freshwater shortages, climate change
and soil degradation. Aquaponics works well in places where the soil is poor
and water is scarce, for example, in urban areas, arid climates and low-lying
islands.
However, commercial aquaponics is
not appropriate in all locations, and many start-ups have failed. Before investing
in large-scale systems, operators need to consider all factors carefully,
especially the availability and affordability of inputs (i.e. fish feed,
building and plumbing supplies), the cost and reliability of electricity, and
access to a significant market willing to pay premium prices for locally
produced, pesticide-free vegetables. Aquaponics combines the risks of both aquaculture
and hydroponics, and thus expert assessment and consultation are essential.
To support aquaponic development,
FAO has produced a technical manual on small-scale aquaponic food production.1
At the Thirty-first Session of the FAO Committee on Fisheries (June 2014), four
Members (the Cook Islands, Indonesia, Kenya and Mexico) cited aquaponics as an
opportunity warranting greater attention. Moreover, a related side event
presented yumina, a form of aquaponics used across Indonesia. As a follow-up,
Indonesia, with support from FAO and the South–South Cooperation team, held a
regional technical workshop on aquaponics in late 2015 to train trainers from
countries around the world. Separately, FAO also convened a training workshop
on aquaponics for countries in the Near East and North Africa region.
In the future, the agriculture
sector will need to produce more with less. Following the principles of efficient
resource use, synergistic benefits can be realized by integrating food
production systems and reducing inputs, pollution and waste, while increasing efficiency,
earnings and sustainability. Thus, aquaponics has the potential to support
economic development and enhance food security and nutrition through efficient resource
use, and become an additional means of addressing the global challenge of food
supply.
AQUACULTURE MAPPING AND
MONITORING
Inventories and monitoring of
aquaculture facilities provide decision-makers with important baseline data on
production, area boundaries, and environmental impacts. Mapping facilitates
such work and improves the effectiveness of interventions for disaster assessment
and emergency preparedness.
The mapping of aquaculture
facilities can be performed accurately, regularly (i.e. minutes, days, months
or years) and at selected scales by remote sensing. Remote sensing – using
satellites, aircraft, drones or fixed sensors – enables observations of vast and
often remote or inaccessible areas at a fraction of the cost of traditional
surveys. It provides a large range of observation data that complement and
extend data acquired from in situ observations to support aquaculture
management.
Challenges for aquaculture
mapping include:
(i)
limited awareness of its
benefits for decision-makers and technical personnel;
(ii)
limited knowledge on how to
conduct inventories and analysis;
(iii) limited number of innovative
mapping applications;
(iv)
limited human resources,
infrastructure and financing.
FAO assists countries in
recording the location and type of aquaculture facilities so they can improve
their aquaculture zoning, site selection and area management. These facilities
and their evolution can be assessed against locations of sensitive ecosystems and
habitats to highlight potential impacts. They can also be linked to the
licensing process to identify unregistered or illegal facilities. FAO’s
National Aquaculture Sector Overview map collection provides a spatial
inventory of aquaculture with attributes including species, culture systems and
production.1 Based on Google Earth/Maps technology, its aim is to develop ways
to assist developing countries and so encourage them to conduct their own
inventories, at minimal cost, as part of their strategic planning for
sustainable aquaculture development. Some have already begun creating their own
farm-level inventories by creating atlases and/or Web mapping applications.
Google Earth is a good starting
point for spatial inventories of aquaculture as it makes high-resolution data
(e.g. satellite images or historical aerial photographs) freely available to
the general public, without requiring any remote-sensing expertise. Despite some
limitations (e.g. obsolete/undated imagery or other layers, insufficient
resolution for some aquaculture applications, and incomplete coverage owing to
cloud cover), such mapping applications should be the first stop in a spatial
data search where base maps and specialized layers are lacking. However,
ground-based data gathering remains important for validation, and here global
positioning systems (GPS) are essential for digitally recording the location of
aquaculture facilities and assessing the accuracy of remote-sensing sources. More
advanced approaches based on image analysis require the use of geographic information
systems (GIS) or remote-sensing software and access to satellite images in
their original format. Digital data (such as from remote sensing) pertaining to
any aspect of aquaculture can be assembled in a GIS. These systems perform a
wide range of spatial and statistical analyses, providing informed answers to
aquaculturists, local managers, government officials and other groups promoting
sustainable aquaculture development.
Advances in remote-sensing and
mapping technologies and spatial analyses will enable improved and more informed
opportunities in aquaculture, especially as these technologies and analyses
become increasingly powerful, cheaper and more accessible to all. In this respect
and thanks to partnerships mobilized through projects around the world, FAO
continues to promote the adaptation and tailoring of innovative methodologies
and capacities to facilitate concurrent access to remote sensing, field
data-collection devices (e.g. GPS, smartphones and tablets), GIS and spatial analysis
by aquaculture stakeholders.
AQUACULTURE AND
CLIMATE CHANGE
The Issue: Climate change will have a range of
impacts on aquaculture.
Possible solutions
There are practical adaptation
measures (“no regret” actions) that can effectively address climate variability
and trends at the farm, local and national levels and even at a global scale. With
these measures, fish farmers and other local stakeholders can play a proactive
role in addressing both long-term changes/trends and sudden changes (e.g.
extreme weather events):
Ø aquaculture zoning to minimize risks (for new aquaculture), and
relocation to less exposed areas (existing farms); „„
Ø appropriate fish health management; „„
Ø increasing efficiency of water use, water recycling, aquaponics,
etc.; „„
Ø increasing feeding efficiency to reduce pressure and reliance on
feed resources; „„
Ø developing better-adapted seed stock (e.g. tolerance to lower
pH, broader salinity resistance, faster-growing strains and species, and other
attributes); „„
Ø ensuring high-quality, reliable hatchery production to
facilitate outgrow in more stressful conditions, and to facilitate rehabilitation
of production after disasters; „„
Ø improvement of monitoring and early warning systems; „„
Ø strengthening farming systems, including better holding
structures (e.g. sturdier cages, depth-adjustable cages [for fluctuating water
levels], deeper ponds) and management practices; „„
Ø Improving harvesting methods and value addition.
AQUACULTURE PRODUCTION
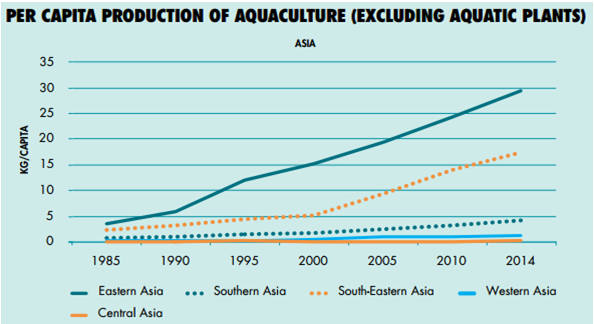
WORLD AQUACULTURE PRODUCTION


ASIAN REGION AQUACULTURE PRODUCTION

ASEAN REGION AQUACULTURE PRODUCTION


MALAYSIA AQUACULTURE PRODUCTION
In 1990, production from
aquaculture was 52 302 tonnes. By 1994, production had doubled to 114 114
tonnes. In 2003, aquaculture production was at 194 139 tonnes at a value of USD
308 million - about 20 percent of the total value of the fisheries production
in Malaysia. Brackish water species accounted for more than 70 percent of the
total aquaculture production in terms of value and quantity. Of these, blood
cockles recorded the highest production, followed by marine shrimp and other
freshwater species, such as tilapia, carps and catfish, as well as marine fish.
Cockles account for almost 50 percent of the total brackish water aquaculture
production, and about 37 percent of the annual aquaculture production. However,
marine shrimp accounted for the highest value of production, with about 65
percent of the total value of brackish water aquaculture production, and 52
percent of the total value of aquaculture production in 2003. Marine and
brackish water aquaculture production recorded an increase of more than 20
percent in comparison to production in 2002. Freshwater aquaculture production,
however, only recorded an increase of about 7 percent in comparison with
production in 2002.
The graph below shows total
aquaculture production in Malaysia according to FAO statistics:
Chart

In 2007 aquaculture production
reached 178 239 tonnes (208 239 tonnes including aquatic plants). The sector
has long been identified as having the most potential for further development.
Among the various culture
systems, the traditional culture of cockle on coastal mudflats on the west
coast of Peninsular Malaysia has dominated, with cockle landings amounting to
more than half the total aquaculture production (excluding seaweeds) until
1999. But, its share in total aquaculture production declined from 42 percent
in 2000 to 28 percent in 2007. This was caused by a decrease in production in
conjunction with a growth in production of most other species. In 2007, cockle
production was 49,620 tonnes, followed by aquatic plants (30,000 tonnes),
tilapia (26,409 tonnes), banana prawn (23,738 tonnes), Clarias catfish (21,892
tonnes) and giant tiger prawn (11,435 tonnes).
Mud flat culture (of cockles) is
the most common production method, followed by freshwater pond culture,
brackishwater pond culture, long-line culture of seaweed, and several other
minor culture systems including marine cage culture of fish, raft culture of
mussel and oyster, mining pool culture of freshwater fishes, freshwater cage
culture, and tank culture of freshwater fishes - in that order. Shrimp culture
in brackishwater pond contributes most in terms of value. The average unit
price for marine shrimps is high, inter alia, because a significant portion is
exported. Lately, the longline culture of seaweed, practised only in Sabah and
negligible during several decades, has been gaining rapidly in importance.
HISTORY OF AQUACULTURE
A SHORT HISTORY OF AQUACULTURE
Origins
The earliest form of aquaculture practiced consisted of trapping wild aquatic animals in lagoons, ponds or small shallow lakes, so that they would be available at all times. This method dates back to the Neolithic age, when man started to act on natural resources, namely around 4000 B.C. in Europe. This minimalist practice no longer exists in Europe because all aquaculture involves at least one technical interaction with the environment or the animal.
The earliest form of aquaculture practiced consisted of trapping wild aquatic animals in lagoons, ponds or small shallow lakes, so that they would be available at all times. This method dates back to the Neolithic age, when man started to act on natural resources, namely around 4000 B.C. in Europe. This minimalist practice no longer exists in Europe because all aquaculture involves at least one technical interaction with the environment or the animal.
In the second stage in its
evolution aquaculture no longer relied solely on nature: aquatic environments
favourable to the development of fish, molluscs and/or crustaceans were
developed. Carp rearing in China is the most sophisticated form of this type of
aquaculture, evidence of which dates back to the fifth century B.C. in the
famous Treatise written by Fan-Li. In South America, the Aztec cultivated
agricultural islands known as chinampas in a system where plants were raised on
stationary (and sometime movable) islands in lake shallows and waste materials
dredged from the chinampa canals and surrounding cities were used to manually
irrigate the plants. This system is believed to be the earliest ancestor of
modern aquaponics.
As for seaweed, the first written
record of human consumption appeared in Japan more than 1500 years ago. However
the intervention of men on seaweed production seems to have started in 1670 AD.
At this time, Japanese fishermen were ordered fresh fish every day for the
Shogun and realised that the bamboo fences used to farm fish were covered by
seaweed. They then realize that they
could make the seaweed grow quicker by moving the bamboo fence in the estuary
where it would receive some nutrient input from the land.
TIMELINE OF WORLD
AQUACULTURE
3500 BC
Cultivation of carp begins in China using freshwater ponds
and rice paddies
2500 BC
Hieroglyphics indicate tilapia were being farmed in Egypt
2000 BC
Oyster farming begins in Japan
746 AD
First reference to clam culture appears in Chinese literature
1400
Marine finfish aquaculture begins in Indonesia when young
milkfish are trapped in coastal
ponds at high tide.
1600s
Seaweed farming begins in Japan
1733
Fish farming in its modern form begins when a German farmer
successfully gathers trout eggs, fertilizes
them, and then grows the hatched fish to maturity
Early 1800s
Oyster farming is further developed by the French by placing
strings of tiles in water for oyster larvae to
settle on and then transplanting the larvae to protected
beds.
Oyster farming expands to the Atlantic coast of the U.S
1853
An Ohio trout farm becomes the first in the U.S. to artificially
fertilize its fish eggs
1880s
Aquaculturists experiment with lobster and winter flounder
aquaculture in New England
1909
The first commercial trout farm in the U.S. established in
Idaho
1910
State and federal hatcheries in the U.S. develop channel
catfish farming techniques
1919
Washington’s oyster farming industry begins when Pacific
oysters from Japan are placed in
coastal waters
1930s
President Franklin D. Roosevelt’s Farm Pond Program
encourages the growth of the U.S. aquaculture
industry by providing federal subsidies for building and
stocking fishponds on farms.
Researchers in Japan make major advances in shrimp farming
techniques
1934
Raft culture of scallop developed in Japan
1940s
Tilapia farming introduced to the Caribbean, Latin America
and the U.S
1950s
Netpen aquaculture is introduced in Japan for the commercial
culture of yellowtail
1951
Intensive seaweed farming begins in China
1960s
Commercial shrimp farming develops in Japan and soon begins
in Ecuador and the U.S
Late 1960s
Sea bass production begins in the Mediterranean.
First commercial salmon farms are established in Norway and
Scotland
1970s
U.S. catfish farm acreage grows from 400 acres in 1960 to
40,000 in 1970.
After nearly collapsing due to disease and a saturated world
salmon market, Norway grows to become the world’s top salmon-farming nation.
Salmon farming expands to the U.S. and Canada.
Abalone hatcheries develop in California.
Mussel aquaculture develops on both coasts of the U.S
1976
New Zealand’s first commercial salmon farm is established.
World aquaculture production is estimated to be 6.1 million
metric tons (mt)
1980s
The National Aquaculture Act of 1980 is passed in the US to
provide for the development of the
aquaculture industry.
Sturgeon farming begins in California.
The commercial farming of hard clams, or quahogs, begins in
New England
1981
Manila clam farming begins in Washington and California
1984
World aquaculture production reaches 10 million mt,
contributing 12 percent of the world’s
aquatic food supply
1985
Salmon farming introduced in Australia
Late 1980s
Shrimp farming industries in Asia and South America undergo
rapid expansion
Early 1990s
World aquaculture production in 1990 is 13 million mt.
Research begins in the Mediterranean on the feasibility of
off-shore aquaculture.
U.S. striped bass and tilapia aquaculture industries
develop.
The Irish sea trout fishery collapses because of sea lice
infestations believed to be caused
by salmon farms.
Shrimp farming industries in many parts of the world
collapse due to outbreaks of disease.
Alaska bans commercial netpen fish farms to protect its wild
fisheries
1991
Tuna farming, in which juvenile wild fish are captured and
then fattened in cages, is established in
Australia
1992
Snapper aquaculture begins in Australia
1994
Between 1984-1994, world aquaculture production grows on
average 11 percent per year.
Maine begins commercial seaweed aquaculture
1995
The British Columbia government places a moratorium on new
salmon farm tenures in
order to conduct an environmental review of the industry.
World aquaculture production is 24 million mt
1996
Canadian researchers patent transgenic salmon
1997
Canada announces plans to fund research in cod farming
1998
Sea bream culture grows from 110 mt in 1985 to 41,900 mt in
1998
1999
World aquaculture production grows 154% over the 1990s.
Production tops
33 million mt and contributes nearly one-third of the
aquatic food supply.
Production of farmed salmon exceeds the amount of salmon
caught in the wild
2000
Farmed salmon production tops one million mt.
Research begins on new aquaculture species such as flounder,
sablefish and halibut.
American aquaculturists induce spawning in cobia, marking
the first step towards
commercial cobia farming
2001
Since 1989, close to three million Atlantic salmon have been
reported escaped from
farms in British Columbia, Washington, Maine, and Scotland.
Infectious salmon anemia (ISA) spreads to Maine forcing
salmon farmers to slaughter
over 1 million fish
2002
Traces of illegal antibiotics are detected in farmed shrimp
imported from Asia.
Officials in British Columbia announce plans to lift the
moratorium on new salmon farms.
Australia’s bluefin tuna farmers produced 9,245 mt for a
value of AU $260.5 million, a three-fold
increase in five years
2003
Salmon farmers in Maine are found in violation of the Clean
Water Act and ordered to fallow their sites for two to three years and cease the use of European strains
of fish at their farms.
Commercially farmed cod available in the US for the first
time.
Offshore fish farming projects, funded by NOAA, exist in
Hawaii, New Hampshire, Puerto Rico, and the Gulf of Mexico.
Sunday, November 13, 2016
GROUPER LIFE CYCLE & SYSTEM
Grouper, known as "kerapu" in Malay. The name "grouper" comes from the Portuguese name "garoupa" for the fish.
Contrary to their name which suggests the fish stays in group, they are actually the solitary type. Unlike snappers which move in groups, they are intolerant of the same species or other similar fishes. Most species gather together in pairs or aggregations only for spawning. Many species are hermaphrodites, meaning that they can change their sex. They start out as females and change to male at a later stage.
There are 64 genera and approximately 521 species worldwide. Malaysia is represented by 15 genera and approximately 68 species.

 1.) Nursery
2.) Ongrowing Techniques
As an overlay on this life cycle are life histories and behaviors that they also share. They are slow to mature and have complex social systems that provide cues for sex change. They also exhibit a high degree of site fidelity within their home ranges and to spawning aggregation sites where they are easy to capture, particularly with the remarkable improvements in navigational gear that allows targeting specific spawning locations.
Sex change in groupers is a one-way street, from female to male. For Gag (Mycteroperca microlepis)-- one of the more important species fished in the eastern Gulf of Mexico—the period in which sex change is initiated is brief, occurring only during the late winter or early spring. At other times, males and females are separated, with males staying offshore on spawning sites while females move to shallower water. All of the reproduction in the population takes place in the brief time the sexes co-occur. So do all the cues for sex change. If there are two few males, then dominant females will change sex so that by the following spawning season, more males are available.
This combination of traits make them highly vulnerable to exploitation and habitat loss. There are currently no management plans in effect to adequately protect either their social structure or their nursery habitat. While marine reserves have proved an effective tool for protecting offshore spawning grounds, they have not been applied to nursery habitat which remains vulnerable to the effects of eutrophication, development, and industrial contamination.


Contrary to their name which suggests the fish stays in group, they are actually the solitary type. Unlike snappers which move in groups, they are intolerant of the same species or other similar fishes. Most species gather together in pairs or aggregations only for spawning. Many species are hermaphrodites, meaning that they can change their sex. They start out as females and change to male at a later stage.
There are 64 genera and approximately 521 species worldwide. Malaysia is represented by 15 genera and approximately 68 species.


There are two production systems used for the nursery stage - indoor and outdoor. The indoor system uses tank sizes of 30-50 m3 while the outdoor system uses ponds of >200 m3.
Outdoor System
Hatchery reared or wild-caught fry are nursed in tanks or hapa nets until they reach 6 cm. Hapa nets [1 x 2 x 1.5 m; -2 mm mesh] are set in tanks or ponds or inside floating net cages and stocked
Indoor System
Nursery tanks vary from 30 to 50 m3 in either semi-intensive or intensive flow-through systems. Such tanks are stocked with 3. Higher densities of over 1 000/m3 are sometimes used in flow-through or recirculation water systems. The fish are graded every 5-7 days until they reach >6 cm after 45-60 days. At this stage, fish are transferred to grow-out ponds or floating cages.
Earthen Pond systems
Ponds are prepared and fertilized. Once natural food is abundant, adult tilapia are added at a stocking density of 5 000-10 000/ha to produce fingerlings to serve as live prey for the groupers. Grouper fingerlings (~6 cm TL) are added at 5 000-10 000/ha at least a month after the release of adult tilapia. Sorting and grading of the fingerlings is carried out weekly to prevent cannibalism and to minimize competition for space and food. If tilapia fingerlings are not abundant, supplementary feeding is carried out using chopped fish at 5 per cent BW/day, half early in the morning and the rest late in the afternoon. When the fish weigh about 200 g, feeding is reduced to once daily with fresh or frozen chopped fish at 5 per cent BW or with pellets at 2 per cent BW. 20-50 per cent water exchange takes advantage of spring tides or pumped water from reservoirs and is carried out at least twice/week. Paddlewheel aerators are used when DO2 falls below 4 ppm. Water quality is maintained at pH 7.5-8.3, 25-32 °C, 20-35 ‰, 4-8 ppm DO2; 2-N) and 3-N.
Floating Net Cage Systems
Net cages (8 mm mesh) are used for 2-10 cm fingerlings; 25 mm mesh is used for larger fish. Grouper fingerlings are stocked at 15-20/m3. Grading is carried out at least once a month. Fish are fed with appropriate fresh or frozen chopped fish daily at 10 per cent BW or with pelleted feeds 3 per cent BW, half early in the morning and half late in the afternoon. 0.5 per cent vitamin and mineral premix is added to the properly thawed trash fish before feeding. Floating net cages should be moved to a new site every 2-3 years of culture to allow deteriorating bottom conditions to recover. The duration of culture in the grow-out phase is 4-7 months, depending on the preferred size at harvest.
3.)Life Cycle of Red Grouper
Juveniles live in shallow-water nearshore hardbottom reefs where they remain for 4 to 5 years. Adults occur in rock formations and crevices of limestone reef as deep as 300 feet. They grow slowly, reaching a maximum weight of about 50 pounds in their 29 years of life. Females reach sexual maturity between the ages of 4 and 6 years when they start to pair spawn with males. They release egg and sperm into the water column and the resultant larvae are pelagic, floating in the plankton for up to 45 d before settling out in hardbottom habitat inshore. As an overlay on this life cycle are life histories and behaviors that they also share. They are slow to mature and have complex social systems that provide cues for sex change. They also exhibit a high degree of site fidelity within their home ranges and to spawning aggregation sites where they are easy to capture, particularly with the remarkable improvements in navigational gear that allows targeting specific spawning locations.
Sex change in groupers is a one-way street, from female to male. For Gag (Mycteroperca microlepis)-- one of the more important species fished in the eastern Gulf of Mexico—the period in which sex change is initiated is brief, occurring only during the late winter or early spring. At other times, males and females are separated, with males staying offshore on spawning sites while females move to shallower water. All of the reproduction in the population takes place in the brief time the sexes co-occur. So do all the cues for sex change. If there are two few males, then dominant females will change sex so that by the following spawning season, more males are available.
This combination of traits make them highly vulnerable to exploitation and habitat loss. There are currently no management plans in effect to adequately protect either their social structure or their nursery habitat. While marine reserves have proved an effective tool for protecting offshore spawning grounds, they have not been applied to nursery habitat which remains vulnerable to the effects of eutrophication, development, and industrial contamination.

Lifecycle of grouper

Statistic that shows the production of grouper fish in Malaysia
Sunday, October 30, 2016
G10's Introduction
Hi, This is Group 10 from PRT 3004 Livestock & Aquaculture.
We are from Bachelor of Engineering (Agricultural and Biosystem),
Faculty of Engineering,UPM.
These are our members:


We are from Bachelor of Engineering (Agricultural and Biosystem),
Faculty of Engineering,UPM.
These are our members:

Goh Jia Quan 181506

Nuramanina Binti Muzaiyin 181501

Muhammed Cham 185166

Malick Camara 185169

Loo Jing Huan 181521
Subscribe to:
Comments (Atom)